PostgreSQL/PostGIS installation and then some
Again this blogpost is mostly a note to oneself. On installing PostgreSQL and its extention PostGIS on Fedora. And then loading and retrieving some spatial data via R.
Matching nearest date
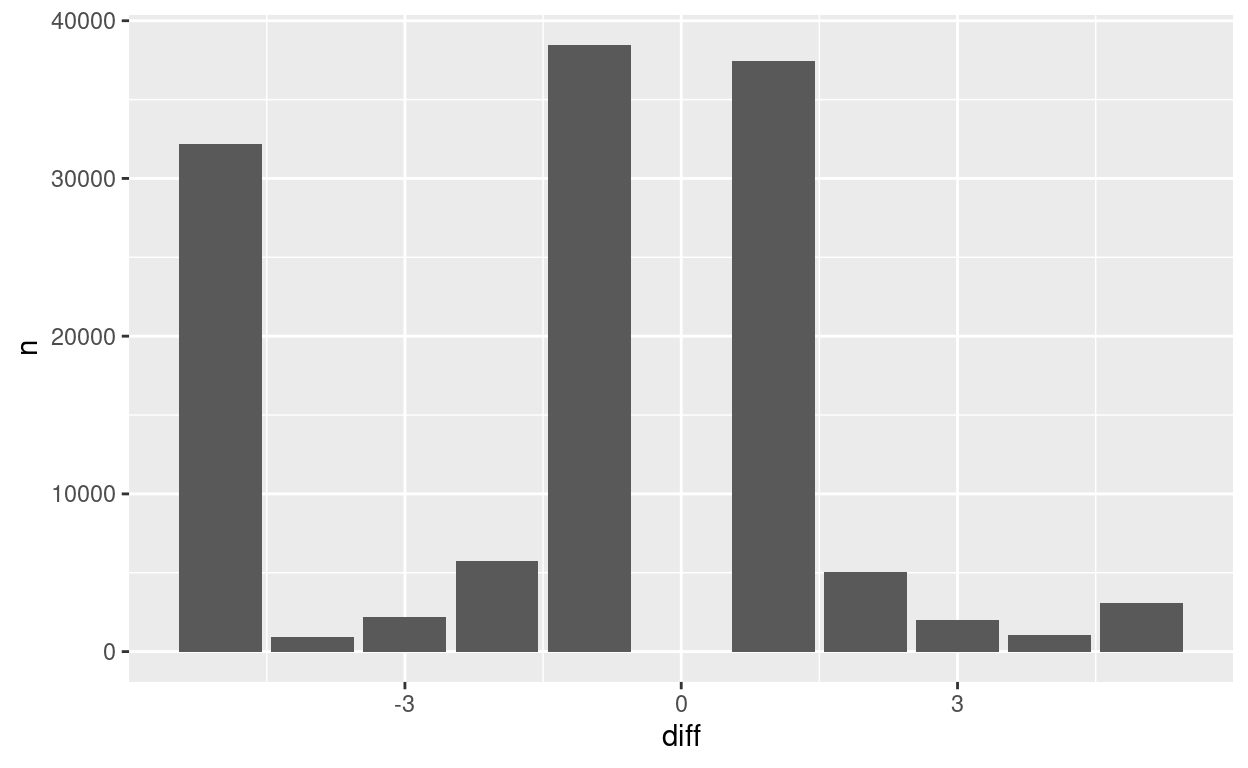
This blogpost is mostly a note to oneself. Some datasets we want to merge or join may not have a variable that matches perfectly. A case in point is if one were to join the logbook and landings dataset by landing date, where the dates can in few cases lag by some two or three days. As of the time this is written there is no available solution in the tidyverse, i.e. a simple join will not work. Hence one needs to move out of that confort zone and dive into the data.table world. Must say the latter is impressive and I have been st(r)aying there more and more.
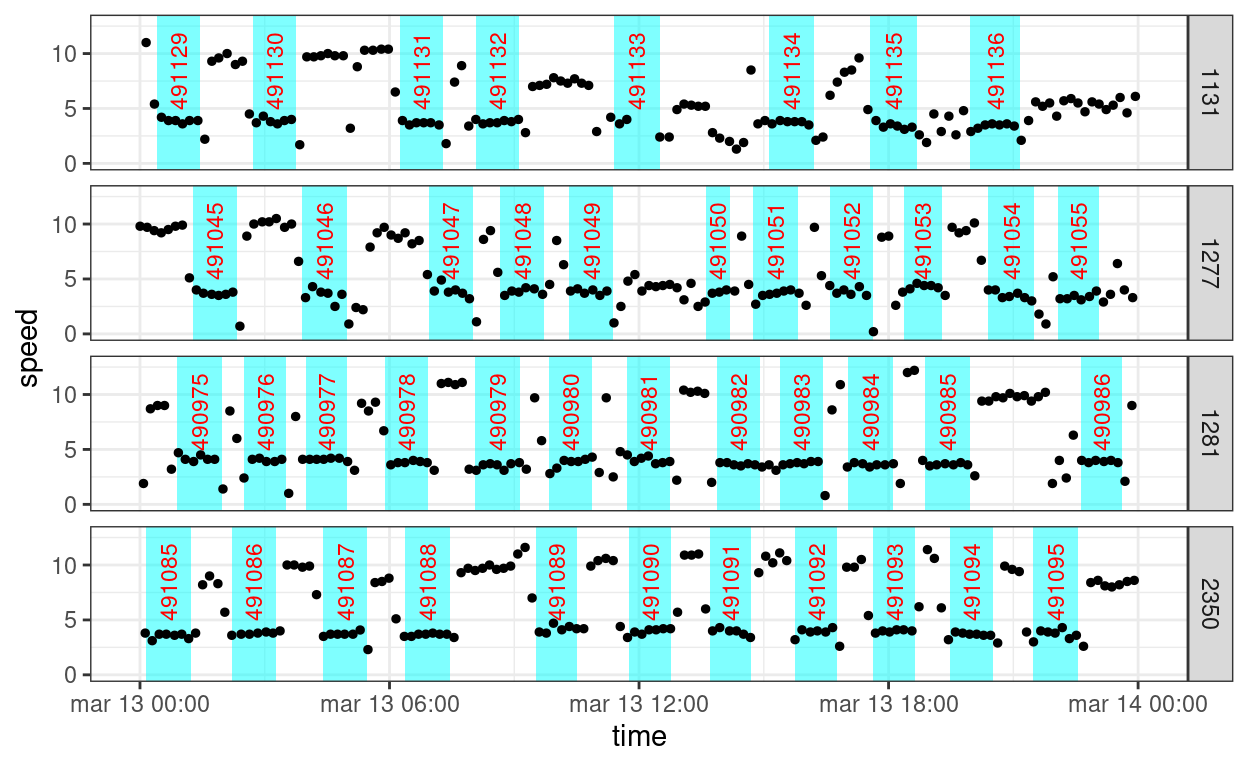
Match points to interval
We have two datasets: 1) Captains logbook data were each activity (e.g. a fish trawl haul) is a record and has variables such start and end time as well as geographical start and end coordinates. 2) Vessel location data (VMS/AIS) were each record is spatial point in time. The VMS/AIS data are relatively frequent with short time interval between records (5 to 10 minutes), while the logbook data are relatively sparse with often relatively large time intervals (i.e. fishing activity is often in units of hours). This post demonstrate how one can match the two datasets containing multiple vessels using the foverlaps function from the data.table package.
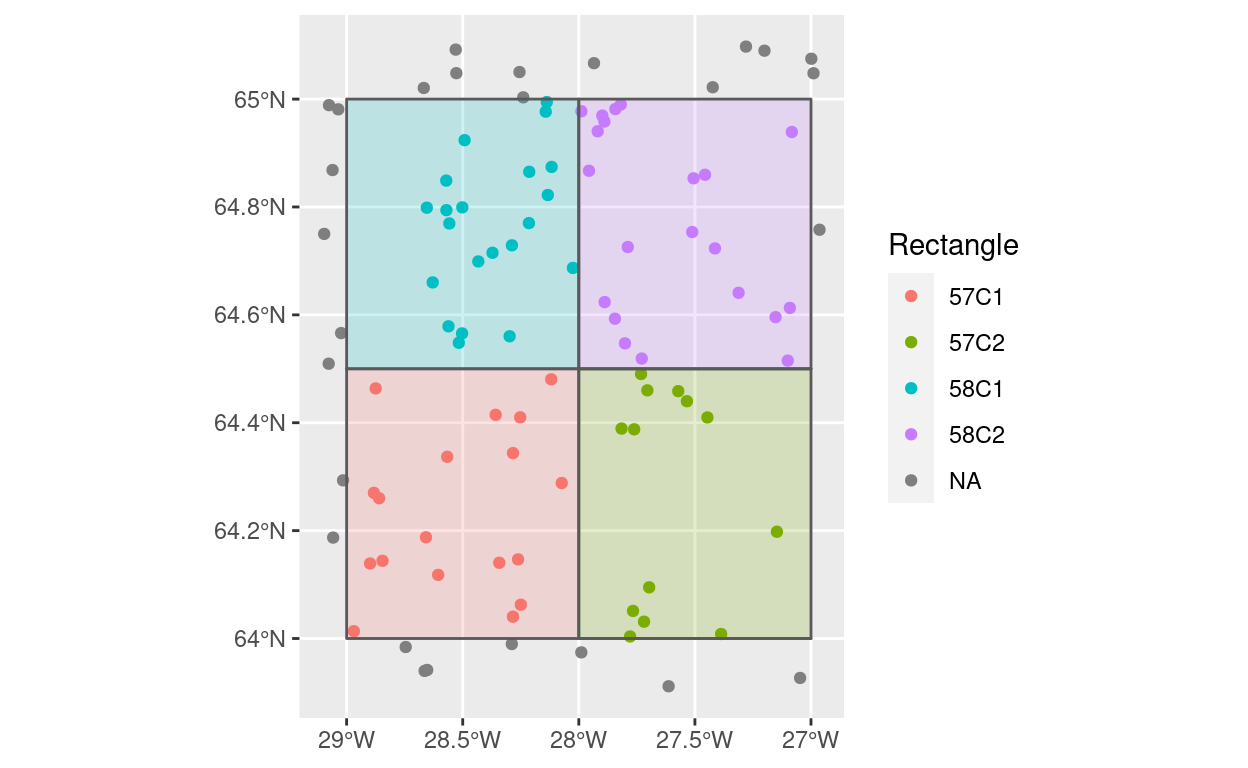
Geoinside: Points in polygons via sf
Lets say we have some spatial areas (polygons) and then some spatial data points. And we are interested to find the area that each point falls into. An example could be finding the ICES statistical rectangles that a set of fishing operations fall under. This problem has been solved many times, this post is only a memo to oneself how this is done using functions in the sf-package using the tidyverse approach. The "geoinside" in the title is a reference to a function in the geo-packages, where such a solution has been available for over two decades, at least to some "insiders".
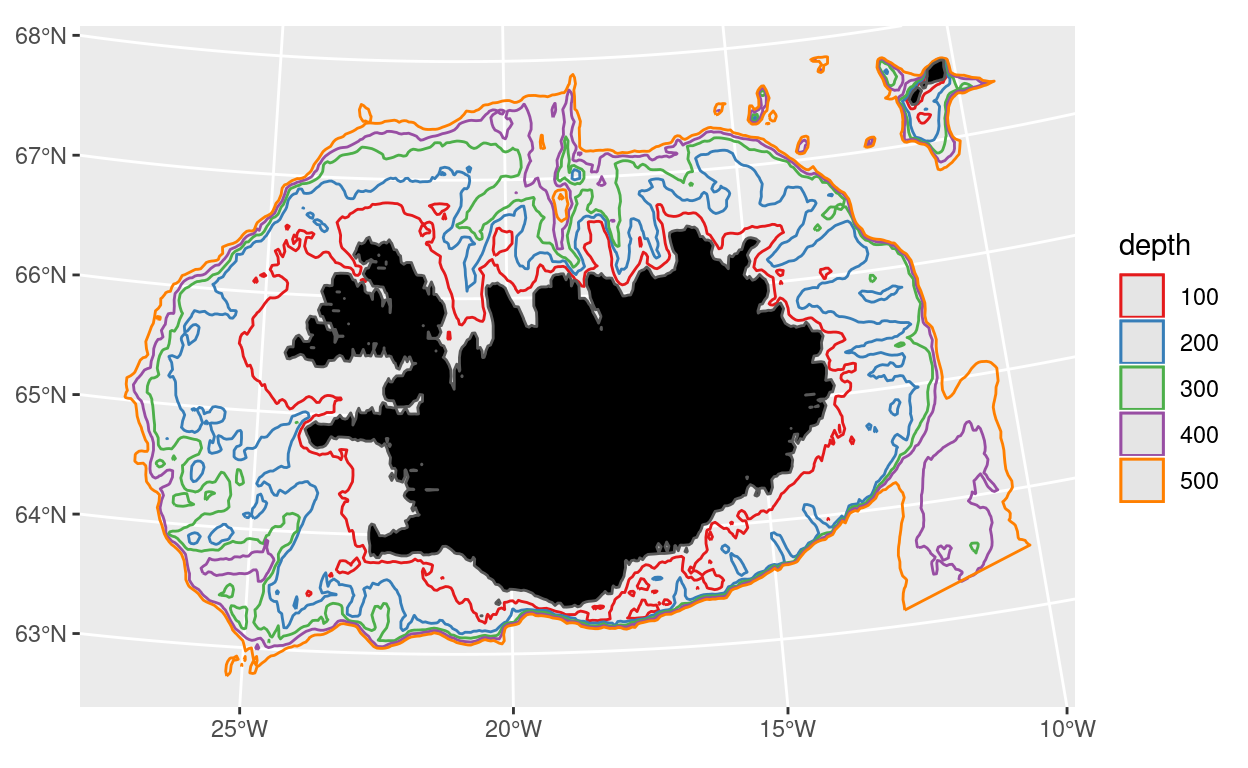
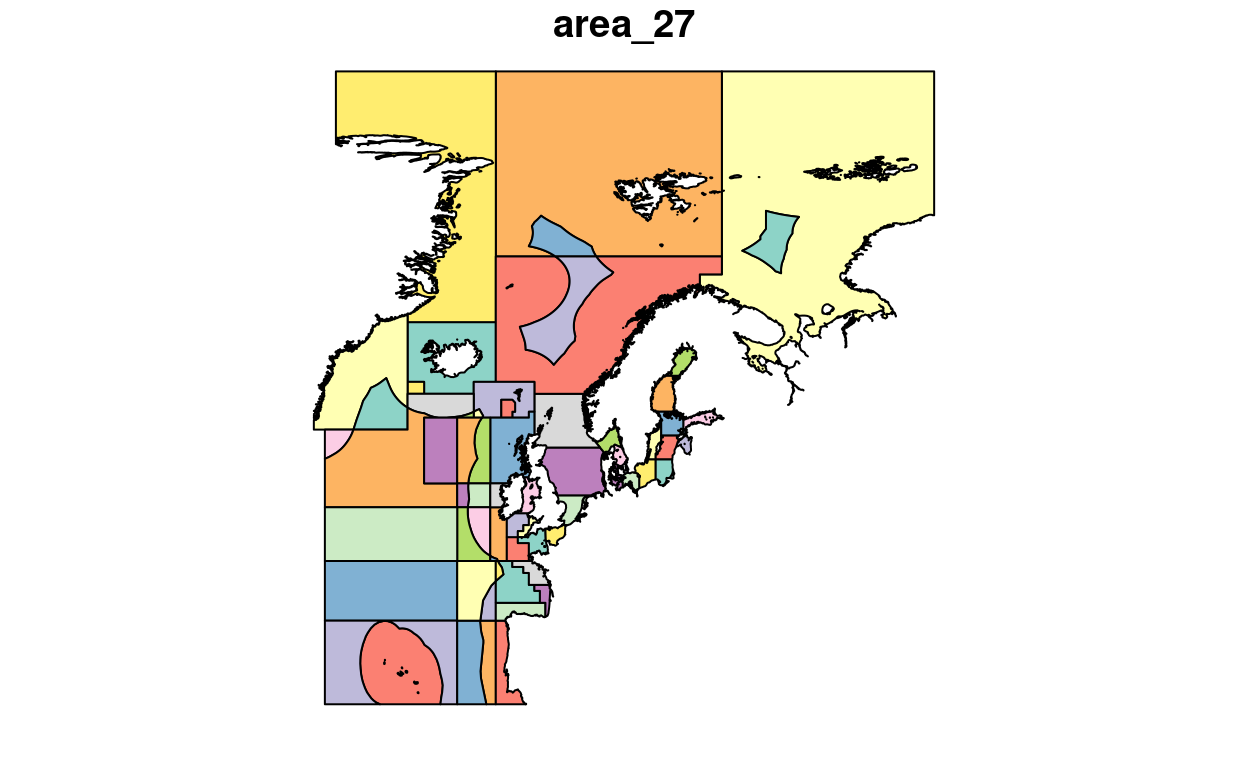
Jan Mayen shelf size
So, there has been some news on cod fisheries in [Jan Mayen](https://en.wikipedia.org/wiki/Jan_Mayen). In that context I became interested in knowing what was the size of the shelf area, a potential proxy for the order of magnitute of cod that this ecosystem could hold. As usual R-comes to the rescue.
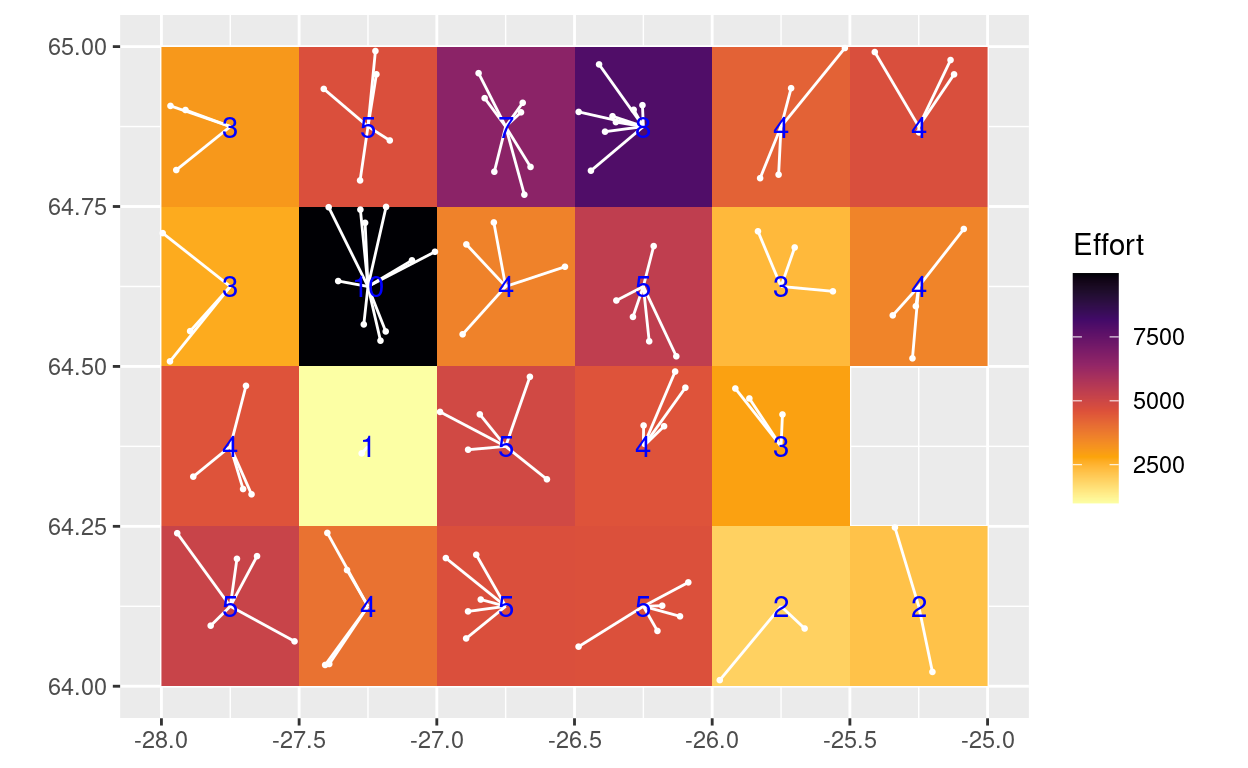
On gridding spatial data
Lets say we have some spatial observations and wanted to calculate some summary metric (count, sum, mean, variance, …) based on specified spacial gridding of the raw data.